imfpy User Guide
imfpy is a python package for searching, retrieving and visualizing International Monetary Fund (IMF) Data.
This package interacts with the IMF’s JSON RESTful API. Documentation on the API is available here: https://datahelp.imf.org/knowledgebase/articles/667681-using-json-restful-web-service. A huge amount of macroeconomic and financial data are available from this IMF’s API, inlcuding (but not limited to):
Trade (DOTS) data
Balance of Payments (BOP) data
Inflation (CPI) data
International Financial Statistics (IFS) data
Many more!
At the moment, retrieval and visualization capacity is limited to the IMF Direction of Trade Statistics (DOTS) database. I plan to add more functionality for some other core databases (BOP, IFS, etc.) in due course.
The base URL is http://dataservices.imf.org/REST/SDMX_JSON.svc/
No API key is required (there used to be a requirement but not anymore). However, the following rate limits apply - no more than:
10 requests in 5 second window from one user (IP)
50 requests per second overall on the application
Installation
imfpy has the following dependencies:
python 3.7 and above
pandas 1.1.3 and above
requests 2.19.0 and above
matplotlib 3.2.2. and above
Installation can be accomplished easily via a pip install.
!pip install imfpy
Requirement already satisfied: imfpy in /home/docs/checkouts/readthedocs.org/user_builds/imfpy/envs/latest/lib/python3.9/site-packages (0.0.2)
Requirement already satisfied: pandas<2.0.0,>=1.1.3 in /home/docs/checkouts/readthedocs.org/user_builds/imfpy/envs/latest/lib/python3.9/site-packages (from imfpy) (1.3.5)
Requirement already satisfied: matplotlib<4.0.0,>=3.2.2 in /home/docs/checkouts/readthedocs.org/user_builds/imfpy/envs/latest/lib/python3.9/site-packages (from imfpy) (3.5.1)
Requirement already satisfied: requests<3.0.0,>=2.19.0 in /home/docs/checkouts/readthedocs.org/user_builds/imfpy/envs/latest/lib/python3.9/site-packages (from imfpy) (2.27.1)
Requirement already satisfied: pyparsing>=2.2.1 in /home/docs/checkouts/readthedocs.org/user_builds/imfpy/envs/latest/lib/python3.9/site-packages (from matplotlib<4.0.0,>=3.2.2->imfpy) (3.0.6)
Requirement already satisfied: packaging>=20.0 in /home/docs/checkouts/readthedocs.org/user_builds/imfpy/envs/latest/lib/python3.9/site-packages (from matplotlib<4.0.0,>=3.2.2->imfpy) (21.3)
Requirement already satisfied: numpy>=1.17 in /home/docs/checkouts/readthedocs.org/user_builds/imfpy/envs/latest/lib/python3.9/site-packages (from matplotlib<4.0.0,>=3.2.2->imfpy) (1.22.1)
Requirement already satisfied: python-dateutil>=2.7 in /home/docs/checkouts/readthedocs.org/user_builds/imfpy/envs/latest/lib/python3.9/site-packages (from matplotlib<4.0.0,>=3.2.2->imfpy) (2.8.2)
Requirement already satisfied: cycler>=0.10 in /home/docs/checkouts/readthedocs.org/user_builds/imfpy/envs/latest/lib/python3.9/site-packages (from matplotlib<4.0.0,>=3.2.2->imfpy) (0.11.0)
Requirement already satisfied: pillow>=6.2.0 in /home/docs/checkouts/readthedocs.org/user_builds/imfpy/envs/latest/lib/python3.9/site-packages (from matplotlib<4.0.0,>=3.2.2->imfpy) (9.0.0)
Requirement already satisfied: fonttools>=4.22.0 in /home/docs/checkouts/readthedocs.org/user_builds/imfpy/envs/latest/lib/python3.9/site-packages (from matplotlib<4.0.0,>=3.2.2->imfpy) (4.28.5)
Requirement already satisfied: kiwisolver>=1.0.1 in /home/docs/checkouts/readthedocs.org/user_builds/imfpy/envs/latest/lib/python3.9/site-packages (from matplotlib<4.0.0,>=3.2.2->imfpy) (1.3.2)
Requirement already satisfied: pytz>=2017.3 in /home/docs/checkouts/readthedocs.org/user_builds/imfpy/envs/latest/lib/python3.9/site-packages (from pandas<2.0.0,>=1.1.3->imfpy) (2021.3)
Requirement already satisfied: charset-normalizer~=2.0.0 in /home/docs/checkouts/readthedocs.org/user_builds/imfpy/envs/latest/lib/python3.9/site-packages (from requests<3.0.0,>=2.19.0->imfpy) (2.0.10)
Requirement already satisfied: urllib3<1.27,>=1.21.1 in /home/docs/checkouts/readthedocs.org/user_builds/imfpy/envs/latest/lib/python3.9/site-packages (from requests<3.0.0,>=2.19.0->imfpy) (1.26.8)
Requirement already satisfied: idna<4,>=2.5 in /home/docs/checkouts/readthedocs.org/user_builds/imfpy/envs/latest/lib/python3.9/site-packages (from requests<3.0.0,>=2.19.0->imfpy) (3.3)
Requirement already satisfied: certifi>=2017.4.17 in /home/docs/checkouts/readthedocs.org/user_builds/imfpy/envs/latest/lib/python3.9/site-packages (from requests<3.0.0,>=2.19.0->imfpy) (2021.10.8)
Requirement already satisfied: six>=1.5 in /home/docs/checkouts/readthedocs.org/user_builds/imfpy/envs/latest/lib/python3.9/site-packages (from python-dateutil>=2.7->matplotlib<4.0.0,>=3.2.2->imfpy) (1.16.0)
Module imfpy.searches
from imfpy import searches
The searches bmodule allows the user to search through the available databases which can be accessed through the API. It uses a simple caching mechanism to store search data efficiently. The intention is that I will build further modules to retrieve data on the basis of user searches. In the meantime, the searches module is still useful for assessing what information is available.
searches.country_codes
Usage: searches.country_codes()
This function returns a dataframe of all IMF databases from which data can be accessed through the JSON API. The resulting dataframe is cached to the local environment.
searches.country_codes()
<Response [200]>
| Country Code | Country | |
|---|---|---|
| 0 | AF | Afghanistan |
| 1 | F19 | Africa not allocated |
| 2 | AL | Albania |
| 3 | DZ | Algeria |
| 4 | AS | American Samoa |
| ... | ... | ... |
| 242 | 1C_440 | Middle East, North Africa, Afghanistan, and Pa... |
| 243 | X88 | Other Countries n.i.e. (IMF) |
| 244 | F6 | Sub-Saharan Africa |
| 245 | A10 | Western Hemisphere |
| 246 | W00 | All Countries, excluding the IO |
247 rows × 2 columns
searches.country_search
Usage: searches.country_search(keyword, regex = False)
This function enables the user to search the country codes data for particular countries. The function returns a pandas dataframe of country codes and countries matching the search, which can be done by normal string methods (the default) or a regular expression (if the user wishes to specify). The search operates on cached data or calls country_codes if the cache is empty.
searches.country_search("germany")
| Country Code | Country | |
|---|---|---|
| 61 | DE2 | East Germany |
| 80 | DE | Germany |
searches.country_search("^B.*a$", regex=True)
| Country Code | Country | |
|---|---|---|
| 24 | BM | Bermuda |
| 26 | BO | Bolivia |
| 27 | BA | Bosnia and Herzegovina |
| 28 | BW | Botswana |
| 31 | BG | Bulgaria |
searches.database_codes
Usage: searches.database_codes()
This function is similar to country_codes but instead returns a pandas dataframe of all accessible databases and database codes. The result is cached to the local environment.
searches.database_codes()
<Response [200]>
| Database ID | Description | |
|---|---|---|
| 0 | AFRREO | Sub-Saharan Africa Regional Economic Outlook (... |
| 1 | AFRREO201410 | Sub-Saharan Africa Regional Economic Outlook (... |
| 2 | AFRREO201504 | Sub-Saharan Africa Regional Economic Outlook (... |
| 3 | AFRREO201510 | Sub-Saharan Africa Regional Economic Outlook (... |
| 4 | AFRREO201604 | Sub-Saharan Africa Regional Economic Outlook (... |
| ... | ... | ... |
| 255 | WHDREO201810 | Western Hemisphere Regional Economic Outlook (... |
| 256 | WHDREO201904 | Western Hemisphere Regional Economic Outlook (... |
| 257 | WHDREO201910 | Western Hemisphere Regional Economic Outlook (... |
| 258 | WHDREO202010 | Western Hemisphere Regional Economic Outlook (... |
| 259 | WoRLD | World Revenue Longitudinal Data (WoRLD) |
260 rows × 2 columns
searches.database_search
This function enables the user to search the database codes data for particular databases. The function returns a pandas dataframe of database codes and databases matching the search, which can be done by normal string methods (the default) or a regular expression (if the user wishes to specify). The search operates on cached data or calls database_codes if the cache is empty.
Usage: searches.database_search(keyword, regex = False)
searches.database_search("development")
| Database ID | Description | |
|---|---|---|
| 112 | FDI | Financial Development Index |
| 246 | UNSDG_IMF_INPUTS | Sustainable Development Goals, IMF Inputs |
searches.database_search("^Financial.*", regex=True)
| Database ID | Description | |
|---|---|---|
| 107 | FAS | Financial Access Survey (FAS) |
| 108 | FAS_2015 | Financial Access Survey (FAS), 2015 |
| 109 | FAS_2016 | Financial Access Survey (FAS), 2016 |
| 110 | FAS_2017 | Financial Access Survey (FAS), 2017 |
| 111 | FAS_2018 | Financial Access Survey (FAS), 2018 |
| 112 | FDI | Financial Development Index |
| 127 | FSI | Financial Soundness Indicators (FSIs) |
| 128 | FSIRE | Financial Soundness Indicators: Reporting enti... |
searches.database_info
Usage: searches.database_info(database_id)
This function returns the high-level information on a particular user-specified database. The idea is that the user should first search for a database using database_search(). If the user wishes to obtain more information about that database they can use database_info() on the desired database code.
searches.database_info('FSI')
<Response [200]>
| Variable | Value | |
|---|---|---|
| 0 | Latest Update Date | 01/14/2022 |
| 1 | Name | Financial Soundness Indicators (FSIs) |
| 2 | Temporal Coverage | Varies by country. |
| 3 | Geographic Coverage | FSIs include data for 126 countries. |
| 4 | Methodology | FSIs are compiled based on the FSI Compilation... |
| 5 | Sectoral Coverage | The data include 40 indicators and their under... |
| 6 | Definition | The Financial Soundness Indicators (FSIs), dev... |
| 7 | Code | FSI |
searches.database_dimensions
Usage: searches.database_dimensions(database_id)
This function returns the dimensions of a particular user-specified database. The idea is that the user should first search for a database using database_search(). If the user wants to access data from that database later, it will be useful to know the dimensions of that particular database (i.e. fields that can be used as API queries). In the example below, CL_FREQ denotes available data frequencies; while CL_INDICATOR_FSI denotes the indicator variables contained in the FSI database.
searches.database_dimensions('FSI')
<Response [200]>
| Database ID | Concept | Scheme | Indicator ID | |
|---|---|---|---|---|
| 0 | FSI | FREQ | FSI | CL_FREQ |
| 1 | FSI | REF_AREA | FSI | CL_AREA_FSI |
| 2 | FSI | INDICATOR | FSI | CL_INDICATOR_FSI |
searches.indicator_dimensions
Usage: searches.indicator_dimensions(indicator_id)
This function returns a dataframe of all indicators and series IDs (i.e. the most granular unit of data apart from individual values) for a given user-specified indicator ID. IMF data is organized hierarchically - the highest (most aggregated) unit is the database; followed by dimensions, followed by indicators, followed by values (the lowest, most disaggregated unit).
searches.indicator_dimensions('CL_INDICATOR_FSI').head(6)
<Response [200]>
| Indicator ID | Series ID | Description | |
|---|---|---|---|
| 0 | CL_INDICATOR_FSI | FS_ODX_GSD_MV_EUR | Financial Soundness Indicators, Balance Sheets... |
| 1 | CL_INDICATOR_FSI | FS_ODX_GSD_MV_XDC | Financial Soundness Indicators, Balance Sheets... |
| 2 | CL_INDICATOR_FSI | FS_ODX_GSD_MV_USD | Financial Soundness Indicators, Balance Sheets... |
| 3 | CL_INDICATOR_FSI | FS_ODX_AFLG_PS_EUR | Financial Soundness Indicators, Balance Sheets... |
| 4 | CL_INDICATOR_FSI | FS_ODX_AFLG_PS_XDC | Financial Soundness Indicators, Balance Sheets... |
| 5 | CL_INDICATOR_FSI | FS_ODX_AFLG_PS_USD | Financial Soundness Indicators, Balance Sheets... |
Module imfpy.retrievals
The retrievals module so far only contains one function: dots() - a highly flexible function to return time series goods trade data between countries from the IMF Direction of Trade (DoTS) Database. Over time the retrievals module will be populated with other functions designed to interact with other key databases. Since I am particularly interested in trade policy, I have focused on trade statistics and designed a lot of functionality around that (and what would be useful to practitioners in the trade policy area).
retrievals.dots
from imfpy.retrievals import dots
Usage: dots(country, counterparts, start, end, freq='A', form='wide')
dots() returns a pandas dataframe of time series trade data to fit the user’s exact specifications. The data is clean and ready for econometric analysis/visualization/presentation as the user requires. dots() is also robust to bad inputs and will throw errors if the user enters invalid or non-requestable parameters.
Note, all data returned is in $USD millions, current prices.
1. Annual data, one counterpart
Return a dataframe of U.S.-China annual trade data from 1995 to 2020.
Note: here, wide and long form data are equivalent since there is one country and one counterpart.
d = dots('US', 'CN', 1995, 2020)
d.head(6)
<Response [200]>
| Period | Country | Counterpart | Exports | Imports | Trade Balance | Twoway Trade | |
|---|---|---|---|---|---|---|---|
| 0 | 1995 | US | CN | 11748.5 | 48520.7 | -36772.2 | 60269.2 |
| 1 | 1996 | US | CN | 11977.9 | 54408.9 | -42431.0 | 66386.8 |
| 2 | 1997 | US | CN | 12805.4 | 65831.7 | -53026.3 | 78637.1 |
| 3 | 1998 | US | CN | 14258.0 | 75109.2 | -60851.2 | 89367.2 |
| 4 | 1999 | US | CN | 12943.6 | 86480.6 | -73537.0 | 99424.2 |
| 5 | 2000 | US | CN | 15963.7 | 106214.7 | -90251.0 | 122178.4 |
2. Monthly data, one counterpart
Return a dataframe of Mexico-World monthly trade data from 2010 to 2020.
d = dots('MX','W00', 2010, 2020, freq='M')
d.round(3).head(6)
<Response [200]>
| Period | Country | Counterpart | Exports | Imports | Trade Balance | Twoway Trade | |
|---|---|---|---|---|---|---|---|
| 0 | 2010-01 | MX | W00 | 19189.889 | 20812.108 | -1622.219 | 40001.997 |
| 1 | 2010-02 | MX | W00 | 21302.600 | 22132.581 | -829.981 | 43435.181 |
| 2 | 2010-03 | MX | W00 | 26104.127 | 27253.551 | -1149.424 | 53357.678 |
| 3 | 2010-04 | MX | W00 | 24844.517 | 26249.847 | -1405.330 | 51094.364 |
| 4 | 2010-05 | MX | W00 | 24796.461 | 26101.417 | -1304.956 | 50897.878 |
| 5 | 2010-06 | MX | W00 | 25000.453 | 26857.078 | -1856.625 | 51857.531 |
3. Annual data, multiple counterparts, wide form
Return a wide-form dataframe of Greece-U.S. and Greece-Germany annual trade data from 2000 to 2019.
Note that the resulting dataframe is organized as a multilevel (hierarchical) pandas dataframe. This may feel unfamiliar to some users but all of the normal functionality of pandas is retained. Note that the wide-form data is indexed by Period, while the long-form data is indexed numerically.
d = dots("GR", ["US", "DE"], 2000, 2019)
d.round(1).head(6) #show first 6 rows only
<Response [200]>
<Response [200]>
| Country | Exports | Imports | Trade Balance | Twoway Trade | |||||
|---|---|---|---|---|---|---|---|---|---|
| Counterpart | DE | US | DE | US | DE | US | DE | US | |
| Period | |||||||||
| 2000 | GR | 4739.2 | 1084.7 | 1605.5 | 639.9 | -3133.7 | -444.8 | 6344.7 | 1724.6 |
| 2001 | GR | 4751.5 | 1023.4 | 1627.1 | 571.7 | -3124.4 | -451.7 | 6378.6 | 1595.0 |
| 2002 | GR | 4892.0 | 1412.9 | 1507.5 | 539.7 | -3384.5 | -873.2 | 6399.5 | 1952.6 |
| 2003 | GR | 6542.6 | 2544.7 | 1967.5 | 795.3 | -4575.1 | -1749.4 | 8510.1 | 3340.0 |
| 2004 | GR | 7991.6 | 1898.9 | 2325.2 | 883.4 | -5666.4 | -1015.5 | 10316.8 | 2782.3 |
| 2005 | GR | 8304.2 | 1429.2 | 2308.1 | 967.9 | -5996.1 | -461.3 | 10612.3 | 2397.0 |
4. Annual data, multiple counterparts, long form
Return a long-form dataframe of Morocco-U.S., Morocco-Algeria, and Morocco-Mozambique annual trade data from 2002 to 2003.
Sometimes, when executing multiple dots() requests in sequence, the requests.json() JSON decoder module breaks down. To circumvent this issue, simply build in some wait time before executing consecutive requests.
#wait 10 seconds before executing the next request
import time
time.sleep(10)
d = dots("MA", ["US", "DZ", "MZ"], 2002, 2003, form="long")
d.round(3).head(6)
<Response [200]>
<Response [200]>
<Response [200]>
| Period | Country | Counterpart | Exports | Imports | Trade Balance | Twoway Trade | |
|---|---|---|---|---|---|---|---|
| 0 | 2002 | MA | US | 509.475 | 241.059 | -268.415 | 750.534 |
| 1 | 2003 | MA | US | 577.220 | 245.524 | -331.696 | 822.744 |
| 0 | 2002 | MA | DZ | 159.586 | 21.298 | -138.288 | 180.884 |
| 1 | 2003 | MA | DZ | 174.591 | 23.766 | -150.826 | 198.357 |
| 0 | 2002 | MA | MZ | 0.003 | 0.050 | 0.047 | 0.054 |
| 1 | 2003 | MA | MZ | 0.060 | 0.047 | -0.013 | 0.107 |
5. Monthly data, multiple counterparts, month start and end date
Return long-form monthly trade data from Developing Asia vs. Japan and Korea between July 2000 and September 2000
As can be seen, dots() can handle complex queries requesting data from countries and country groups with precisely defined start and end dates.
d = dots("XS25", ["JP", "KR"], 2000.07, 2000.09, freq="M", form="long")
d.round(2).head(6)
<Response [200]>
<Response [200]>
| Period | Country | Counterpart | Exports | Imports | Trade Balance | Twoway Trade | |
|---|---|---|---|---|---|---|---|
| 0 | 2000-07 | XS25 | JP | 7523.62 | 8019.14 | -495.52 | 15542.76 |
| 1 | 2000-08 | XS25 | JP | 8205.39 | 8197.84 | 7.55 | 16403.24 |
| 2 | 2000-09 | XS25 | JP | 8264.57 | 8118.79 | 145.78 | 16383.37 |
| 0 | 2000-07 | XS25 | KR | 1875.31 | 3200.34 | -1325.03 | 5075.65 |
| 1 | 2000-08 | XS25 | KR | 1995.56 | 3374.00 | -1378.44 | 5369.56 |
| 2 | 2000-09 | XS25 | KR | 1888.29 | 3394.33 | -1506.04 | 5282.62 |
6. Annual data, multiple counterparts, month start and end date
Return Kuwait-Iran and Kuwait-Turkey annual trade data from May 2000 to April 2002.
Note that here, start and end date format (monthly) do not match the frequency of data requested (annual). In this case, dots() rounds down the start date to the nearest whole year, and rounds up the end date to the nearest whole year.
d = dots("KW", ["IR", "TR"], 2000.5, 2002.4)
d.round(1)
<Response [200]>
<Response [200]>
| Country | Exports | Imports | Trade Balance | Twoway Trade | |||||
|---|---|---|---|---|---|---|---|---|---|
| Counterpart | IR | TR | IR | TR | IR | TR | IR | TR | |
| Period | |||||||||
| 2000 | KW | 9.5 | 26.1 | 115.1 | 115.8 | -105.6 | -89.7 | 124.7 | 142.0 |
| 2001 | KW | 7.0 | 19.2 | 127.2 | 136.2 | -120.2 | -117.0 | 134.3 | 155.4 |
| 2002 | KW | 5.6 | 15.4 | 144.2 | 185.2 | -138.6 | -169.9 | 149.9 | 200.6 |
| 2003 | KW | 6.8 | 18.6 | 189.7 | 223.7 | -182.9 | -205.1 | 196.5 | 242.4 |
dots() is robust to a wide variety of inputs, and will warn the user of invalid inputs before sending bad requests to the API.
All of the following requests will trigger an AssertionError warning the user of how to correct their input in order to build a valid request.
dots("CN","MX", 1000, 2020, "A", "wide"), #bad start year
dots("CN","CN", 1980, 2020, "A", "wide"), #country==counterparts
dots("CN",["MX"], 1980, 2020, "A", "wide"), #counterparts is a list length 1
dots("CN",["MX","CN"], 1980, 2020, "A", "something else"), #country in counterparts
dots(["CN","MX"],"MX", 1980, 2020, "A", "wide"), #country is a list
dots("CN","MX", 2020, 2018, "A", "wide"), #start > end
dots("CN",["MX","ZZ"], 2000, 2018, "A", "wide"), #invalid country
dots("CN","MX", 2020.12, 2020.01, "M", "wide"), #start >end, month
dots("CN",["MX",True], 2020.15, 2018, "M", "long"), #invalid counterparts list
dots("CN","MX", 2020.15, 2018, "M", "long"), #invalid month
dots("CN","MX", 2020.2, 2018, "A", "long"), #invalid month format
dots("CN","MX", 1950.05, 2018, "M", "long") #missing data
---------------------------------------------------------------------------
AssertionError                            Traceback (most recent call last)
Input In [20], in <module>
----> 1 dots("CN","MX", 1000, 2020, "A", "wide"), #bad start year
      2 dots("CN","CN", 1980, 2020, "A", "wide"), #country==counterparts
      3 dots("CN",["MX"], 1980, 2020, "A", "wide"), #counterparts is a list length 1

File ~/checkouts/readthedocs.org/user_builds/imfpy/envs/latest/lib/python3.9/site-packages/imfpy/retrievals.py:72, in dots(country, counterparts, start, end, freq, form)
     70 assert freq=="M" or freq=="A", "frequency must be M or A"
     71 assert form in ['long', 'wide'], "form must be long or wide"
---> 72 assert start > 1800 and start < 2200, "start must be a reasonable date"
     73 assert end > 1800 and end < 2200, "end must be a reasonable date"
     74 assert end >= start, "end must be after start"

AssertionError: start must be a reasonable date
Module 3: imfpy.tools
Over time my idea is to include more tools in this module that help to conduct rudimentary analysis on the returned data. For now, I have a single function dotsplot() that takes in a long-form pandas DataFrame (of the type returned by retrievals.dots(), or else it will throw an error) and returns plots of variables selected by the user.
tools.dotsplot
Usage: dotsplot(dots_dataframe, subset=['Exports', 'Imports', 'Trade Balance'])
from imfpy.tools import dotsplot
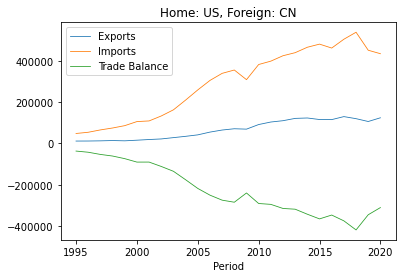
dotsplot() takes an arbitrary dots_dataframe (pandas DataFrame returned by retrievals.dots()) in long-form, and plots time series charts of variables selected by the user. These variables are entered as a list in the optional argument subset. Options are ‘Exports’, ‘Imports’, ‘Trade Balance’ and ‘Twoway Trade’ - all the variables contained in the DOTS database. The default option is ['Exports', 'Imports', 'Trade Balance'].
This function can handle the results of multi-counterpart, complex dots queries and graph them easily. It is also robust to invalid inputs and will warn the user if they try to supply incorrect/badly formatted data or invalid subset parameters.
1. Plot annual time series for one counterpart
Plot annnual time series data of US-China trade from 1995 to 2020 for the default variables Exports, Imports and Trade Balance
Note, we do not need to specifiy form="long" in the original dots() query for dotsplot() to work, since long and wide form data are equivalent for this query.
d = dots('US', 'CN', 1995, 2020)
dotsplot(d)
<Response [200]>
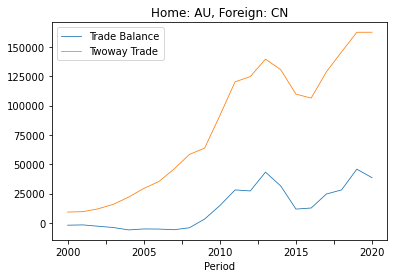
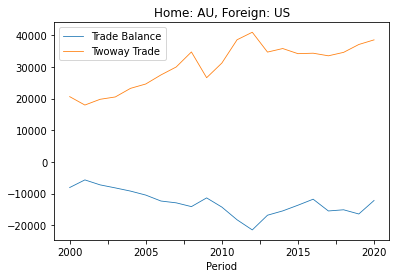
2. Plot annual time series, selected by user, for one counterpart
Plot annnual time series data of Australia-US and Australia-China trade from 2000 to 2020 on the variables Trade Balance and Two-way Trade
d = dots('AU',['US','CN'], 2000, 2020, freq='A', form="long")
dotsplot(d, subset=['Trade Balance', 'Twoway Trade'])
<Response [200]>
<Response [200]>
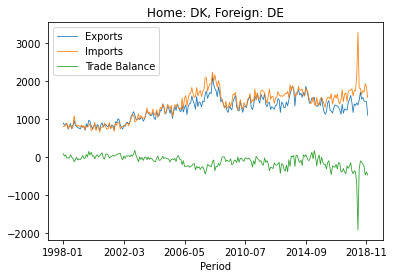
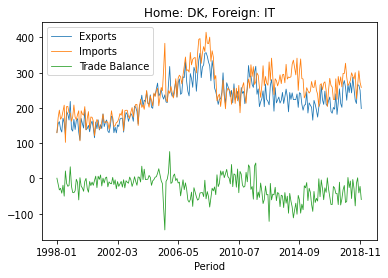
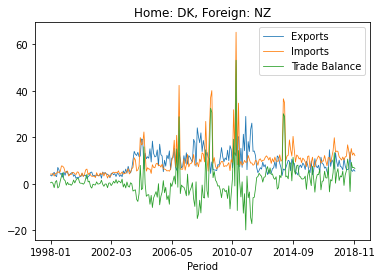
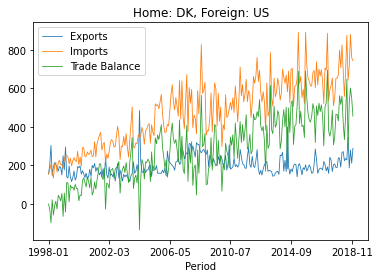
3. Plot monthly time series for multiple countries in a single command
Plot monthly time series data of Denmark-US and Denmark-New Zealand, Denmark-Germany and Denmark-Italy trade from 1998 to 2018 on the default variables.
The dots() and dotsplots() methods can be chainedtogether in a single line.
dotsplot(dots("DK", ["US", "NZ", "DE", "IT"], 1998, 2018, "M", "long"))
<Response [200]>
<Response [200]>
<Response [200]>
<Response [200]>